After you’ve run Managed Autoscaling, Spark Dynamic Allocation, and manually tuned your workloads, Pepperdata still automatically saves you 30% or more.
After you’ve run Managed Autoscaling, Spark Dynamic Allocation, and manually tuned your workloads, Pepperdata still automatically saves you 30% or more.
After you’ve run Managed Autoscaling, Spark Dynamic Allocation, and manually tuned your workloads, Pepperdata still automatically saves you 30% or more.


Spark Application Waste Still Exists
Despite Traditional Optimizations
Traditional infrastructure optimizations don’t eliminate the problem of application waste due to unused capacity at the Spark task and executor level. Pepperdata automatically closes this gap and saves you more.
Traditional infrastructure optimizations don’t eliminate the problem of application waste due to unused capacity at the Spark task and executor level. Pepperdata automatically closes this gap and saves you more.
Traditional infrastructure optimizations don’t eliminate the problem of application waste due to unused capacity at the Spark task and executor level. Pepperdata automatically closes this gap and saves you more.
Managed Autoscaling
Doesn’t prevent Spark from wasting requested resources
Spark Dynamic Allocation
Doesn’t prevent overprovisioning within tasks
Manual Tuning
Can’t keep up with the continuous and changing app resource requirements
Managed Autoscaling
Doesn’t prevent Spark from wasting requested resources
Spark Dynamic Allocation
Doesn’t prevent overprovisioning within tasks
Manual Tuning
Can’t keep up with the continuous and changing app resource requirements

Pepperdata Capacity Optimizer

-

Reduce instance hours and costs
Save an average of 30-47 percent on Spark workload costs on Amazon EMR and Amazon EKS.
-
Optimize Spark clusters for efficiency
Minimize (or eliminate) waste in Spark to run more applications without additional spend.
-
Eliminate manual tuning and tweaking
Free developers from the tedium of managing individual apps so they can focus on more innovative and strategic tasks.
Reduce Operational Costs, Maximize Savings
Data from 2023 Pepperdata TPC-DS Benchmark
41.8%
Cost Savings: Reduced instance hour consumption
45.5%
Improved Performance: Decreased application runtime
26.2%
Increased Throughput: Uplift in average concurrent container count
TPC-DS is the Decision Support framework from the Transaction Processing Performance Council. TPC-DS is an industry-standard big data analytics benchmark. Pepperdata’s work is not an official audited benchmark as defined by TPC. TPC-DS benchmark results (Amazon EKS), 1 TB dataset, 500 nodes, and 10 parallel applications with 275 executors per application.
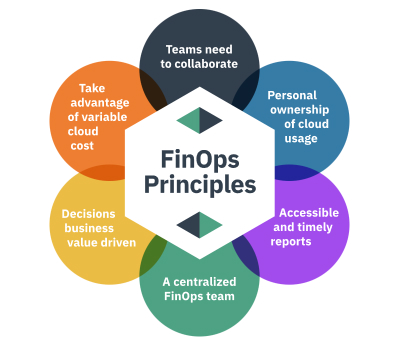
Pepperdata Provides Immediate Value for Your Augmented FinOps
Pepperdata amplifies the success of FinOps teams through its real-time,
autonomous and continuous cloud cost optimization solution.
-

Continuous Intelligent Application Tuning
Pepperdata maintains workloads continuously in their optimal sweet spot by automating application tuning in real time.
-

Enhanced Resource Utilization
Pepperdata optimization increases resource utilization without manual intervention, freeing your IT teams to focus on higher value tasks.
-
FinOps Focused Dashboard
Experience a dashboard that empowers the collaboration of financial teams and technical teams.


Customers Love Pepperdata
If you’re running Spark, give us 6 hours,
We’ll save you 30% on top of everything you’ve already done.
If you’re running Spark, give us 6 hours, We’ll save you 30% on top of everything you’ve already done.
If you’re running Spark, give us 6 hours, We’ll save you 30% on top of everything you’ve already done.

 Cloud Cost Management
 Enterprise Cloud Cost