“Why is Spark So Slow?”
When Apache Spark works well, it works really well. Sometimes, though, users find themselves asking this frustrating question.
Spark is such a popular large-scale data processing framework because it is capable of performing more computations and carrying out more stream processing than many other data processing solutions. Compared to popular conventional systems like MapReduce, Spark is 10-100x faster. But while capable of handling an impressively wide range of workloads and big data sets, Spark can sometimes struggle. Here’s why, and here’s what you can do about it.
What Slows Spark Down?
You may have already tried a few Apache Spark performance tuning techniques—but your applications are still slow. At this point, it’s time you dive deeper into your Spark architecture, and determine what is making your instance sluggish.
1. Driver Failure
In a Spark architecture, the driver functions as an orchestrator. As a result, it is provisioned with less memory than executors. When a driver suffers an OutOfMemory (OOM) error, it could be the result of:
- rdd.collect()
- sparkContext.broadcast
- Low driver memory configured vs. memory requirement per the application
- Misconfiguration of spark.sql.autoBroadcastJoinThreshold
Simply put, an OOM error occurs when a driver is tasked to perform a service that requires more memory or tries to use more memory than it has been allocated. Two effective Spark tuning tips to address this situation are:
- increase the driver memory
- decrease the spark.sql.autoBroadcastJoinThreshold value
2. High Concurrency
Sometimes, Spark runs slowly because there are too many concurrent tasks running.
The capacity for high concurrency is a beneficial feature, as it provides Spark-native fine-grained sharing. This leads to maximum resource utilization while cutting down query latencies. Spark divides jobs and queries into multiple phases and breaks down each phase into multiple tasks. Depending on several factors, Spark executes these tasks concurrently.
However, the number of tasks executed in parallel is based on the spark.executor.cores property. While high concurrency means multiple tasks are getting executed, the executors will fail if the value is set to too high a figure, without due consideration to the memory.
3. Inefficient Queries
Why is Spark so slow? Maybe you have a poorly written query lurking somewhere.
By design, Spark’s Catalyst engine automatically attempts to optimize a query to the fullest extent. However, any optimization effort is bound to fail if the query itself is badly written. For example, consider a query programmed to select all the columns of a Parquet/ORC table. Every column requires some degree of in-memory column batch state. If a query selects all columns, that results in a higher overhead.
A good query reads as few columns as possible. A good Spark performance tuning practice is to utilize filters wherever you can. This helps limit the data fetched to executors.
Another good tip is to use partition pruning. Converting queries to use partition columns is one way to optimize queries, as it can drastically limit data movement.
Check out how we do it>>
4. Incorrect Spark Configuration
Getting memory configurations right are critical to the overall performance of a Spark application.
Each Spark app has a different set of memory and caching requirements. When incorrectly configured, Spark apps either slow down or crash. A deep look into the spark.executor.memory or spark.driver.memory values will help determine if the workload requires more or less memory.
YARN container memory overhead can also cause Spark applications to slow down because it takes YARN longer to allocate larger pools of memory. YARN runs every Spark component, like drivers and executors, within containers. The overhead memory it generates is actually the off-heap memory used for JVM (driver) overheads, interned strings, and other metadata of JVM.
When Spark performance slows down due to YARN memory overhead, you need to set the spark.yarn.executor.memoryOverhead to the right value. Typically, the ideal amount of memory allocated for overhead is 10% of the executor memory.
5. Lack of Optimization
To ensure you are maximizing price/performance, it’s important to make sure that your Spark workloads aren’t running slowly or running at inflated cost. Without proper optimization, costs can skyrocket, and there can be delays in job completion.
Here are some effective ways to keep your Spark architecture, nodes, and apps running at optimal levels.
-
Data Serialization
This particular Spark optimization technique converts an in-memory data structure into a different format that can be stored in a file or delivered over a network. With this tactic, you can dramatically enhance the performance of distributed applications. The two popular methods of data serialization are:
Java serialization – You serialize data using the ObjectOutputStream framework, with the java.io.Externalizable leveraged to give you total control over the performance of the serialization. Java serialization provides lightweight persistence.
Kyro serialization – Spark utilizes the Kryo serialization library (v4) to serialize objects faster than Java serialization. This is a more compact method. To really enhance the performance of your Spark application by using Kyro serialization, the classes must be registered via the registerKryoClasses method.
-
Caching
Caching is a highly efficient optimization technique used when working with data that is repeatedly required and queried. Cache() and persist() are great for storing the computations of a Data Set, RDD, and DataFrame.
The thing to remember is that cache() puts the data in the memory, whereas persist() stores it in the storage level specified or defined by the user. Caching helps bring down costs and saves time when dealing with repeated computations, as reading data from memory is much faster than reading from disk.
-
Data Structure Tuning
Data structure tuning reduces Spark memory consumption. Data structure tuning usually involves:
- Using enumerated objects or numeric IDs instead of strings for keys
- Refraining from using many objects and complex nested structures
- Setting the JVM flag to xx:+UseCompressedOops if the memory size is less than 32 GB
-
Garbage Collection Optimization
Garbage collection is a memory management tool. Each application stores data in memory, and that in-memory data has a life cycle. Garbage collection marks which data is no longer needed, marks it for removal, and removes it. The removal takes place during a pause of the application. These pauses are to be avoided. When garbage collection becomes a bottleneck, leveraging the G1GC garbage collector with -XX:+UseG1GC has been proven to be more efficient.
-
Autonomous Optimization
Of course you can always do all of the above tweaking and tuning to keep your Spark apps running efficiently, but autonomous optimization is a massive changer because it eliminates the need for all that and frees you from the tedium of manually staying on top of individual apps.
Pepperdata Capacity Optimizer eliminates the hassle of manual tweaking and tuning your Spark applications by:
- Automatically adjusting cluster resources in real time
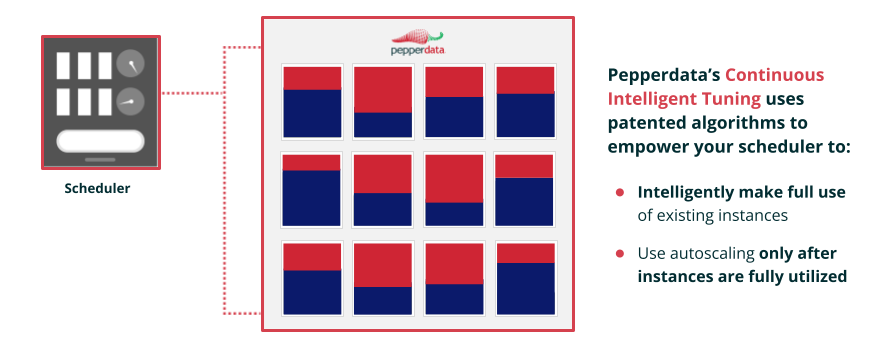
- Enabling the Scheduler to more fully utilize available resources per each workload before adding new nodes or pods
- Dynamically tuning your autoscaler to respond to your changing workloads in real time
Working in real time, Capacity Optimizer autonomously identifies unused capacity where more work can be done and automatically adds tasks to nodes with available resources. The result: Spark CPU and memory resources are automatically optimized to increase utilization, enabling more applications to be launched in both Kubernetes and traditional big data environments.
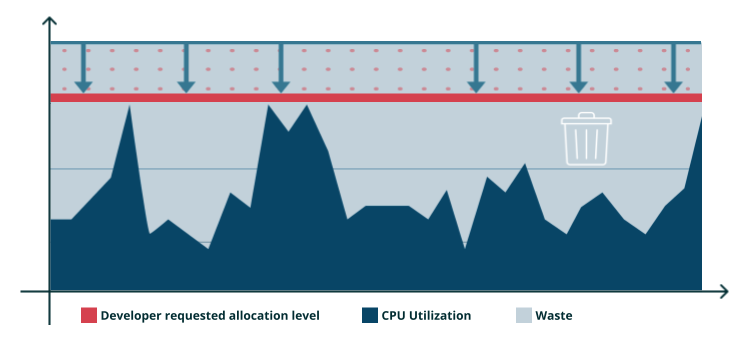
Here’s a deeper dive into how Capacity Optimizer works. In a typical Spark environment, you allocate the memory and CPU you think your applications will need at peak, even if that peak time only represents a tiny fraction of the whole time the application is running.
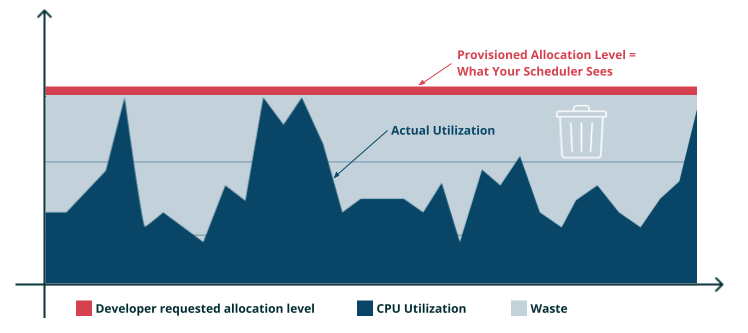
But the reality is that during the application runtime, memory and CPU usage aren't static; they go up and down. When the application is not running at peak, which might be as much as 80 or 90% of the time, that’s waste that you or your company are paying for.
To Minimize Waste, Developers Try to Size Their Resource Requests

Another issue is that allocating memory and CPU is not a “one and done” operation. Since the work profile or data set might change at any time, requiring allocations to be adjusted accordingly, running your applications can become a neverending whack-a-mole story of constantly tuning and re-tuning to try to stay close to actual usage.
Manual tweaking and tuning can help adjust your provisioning line downward and recover some waste, but even if you adjust the allocation level, there is still built-in application waste since no job runs at provisioned peak continually. And there’s no way you can stay on top of your Spark apps every moment of every day.
Your Scheduler Only Sees the Developer's Requested Allocation Level

That’s where Capacity Optimizer steps in to complement your efforts. Capacity Optimizer enables the scheduler to understand the actual CPU utilization at each moment in time, rather than the provisioned allocation level. With Pepperdata Capacity Optimizer engaged, you can autonomously recover additional waste second by second, node by node, instance by instance in real time.
That’s where Capacity Optimizer steps in to complement your efforts. Capacity Optimizer enables the scheduler to understand the actual CPU utilization at each moment in time, rather than the provisioned allocation level. With Pepperdata Capacity Optimizer engaged, you can autonomously recover additional waste second by second, node by node, instance by instance in real time.

If saving up to 30% on average on your Spark applications sounds compelling, you can learn more here or explore a FREE Cost Optimization Demo to see Capacity Optimizer at work and understand how to optimize utilization in your Spark applications, automatically, continuously, and without the hassle of manual tuning.


