Pepperdata Capacity Optimizer
Pepperdata Capacity Optimizer
Pepperdata’s real-time cloud cost optimization is the only solution that addresses in-application waste automatically.
- Removes the need for manual tuning, applying recommendations, or changing application code
- Eliminates the waste inside the application that other optimizations can’t
- Frees engineers from tedious optimization tasks and empowers them to focus on innovation
Compare conventional optimizations to
Pepperdata Real-Time Cost Optimization
Compare conventional optimizations to Pepperdata
Most cloud cost optimization solutions focus only on improving infrastructure price/performance. Pepperdata Capacity Optimizer immediately and automatically reduces the often unnoticed waste inside the Spark application itself.
Pepperdata Capacity Optimizer immediately and automatically reduces the often unnoticed waste inside the Spark application itself that can significantly inflate your costs.
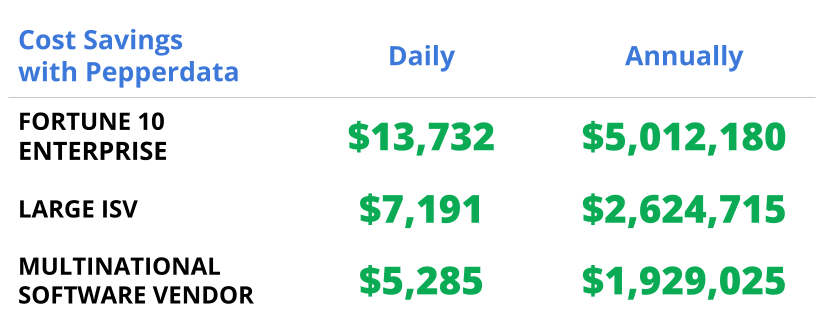
Pepperdata customers save an average of 30 percent on their Spark workload costs in the cloud on top of the other optimization methods.
Autonomous
Dynamically optimizes without manual intervention or recommendations
Continuous
Automatically calibrates resources 24/7 based on application needs
Real Time
Identifies waste and optimizes resources in real time without models
Autonomous
Dynamically optimizes without manual intervention or recommendations
Continuous
Automatically calibrates resources 24/7 based on application needs
Real Time
Identifies waste and optimizes resources in real time without models
Augmented FinOps for Spark on Amazon EMR and Amazon EKS
Augmented FinOps for Spark
Pepperdata’s Augmented FinOps solution works automatically in real time to maximize the optimization of your cloud deployments. Here’s how it does it.
-

Cloud usage and cost transparency
Observe and identify cloud cost data at the Spark application layer.
-

Workload optimization
Run more apps without additional spend by packing pending pods onto underutilized nodes automatically in real time.
Autodesk reduces Amazon EMR costs by 50%
“Pepperdata allowed us to significantly increase capacity for our Amazon EMR workloads and reduce our EC2 costs by over 50 percent. We can focus on our business, while they optimize for costs and performance.”
—Mark Kidwell, Chief Data Architect, Platforms and Services, Autodesk
-

Challenge
Autodesk was experiencing runaway costs as they scaled its Spark workloads
-

Solution
Autodesk installed Pepperdata Capacity Optimizer to automate cloud cost optimization in real time
-

Results
Autodesk successfully reduced Amazon EC2 costs by over 50 percent