If you’re like most companies running large-scale data intensive workloads in the cloud, you’ve realized that you have significant quantities of waste in your environment. Smart organizations implement a host of FinOps activities to ameliorate or address this waste and the cost it incurs, things such as:
- Implementing Savings Plans
- Purchasing Spot Instances and Reserved Instances
- Manually tuning your infrastructure platform
- Enabling Graviton instances
- Rightsizing instances
- Making configuration tweaks
… and the list goes on.
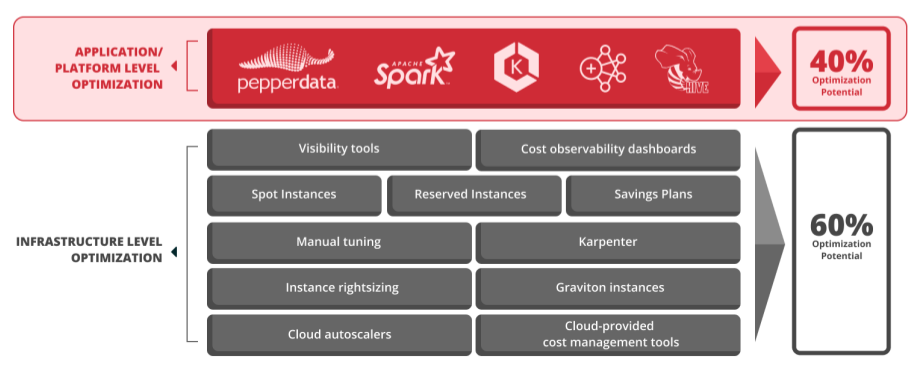
These are infrastructure-level optimizations. Optimization at this level saves money at the hardware layer and ensures that you are getting the best financial return on your infrastructure investment. But only about 60 percent of the waste in your environment exists at the infrastructure level, per this diagram:
What remains untouched is the waste at the application/platform level where your applications run, which typically comprises around 40 percent of the waste and optimization potential in your environment.
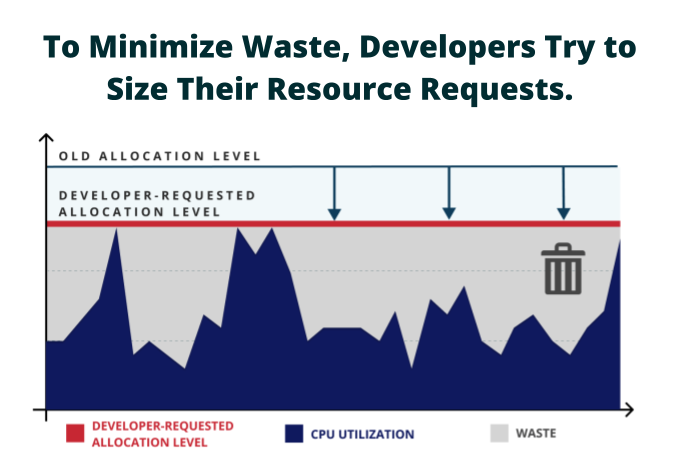
This waste is not your fault, nor is it the fault of your developers. It’s an inherent issue in application resource provisioning, particularly with Apache Spark. Your developers have to request a certain allocation level of memory and CPU for their applications, and they typically request resources to accommodate peak usage; otherwise their applications get killed.
However, most applications run at peak provisioning levels for only a small fraction of time, which results in most applications having extra resource provisioning—or waste—built in from the start.
You might be operating the most efficient infrastructure in the world, but if your applications are overprovisioned, they’re going to use that infrastructure inefficiently. And these inefficiencies can be significant, especially across batch applications like Spark. On average, typical applications can be overprovisioned by 30 to 50 percent or sometimes more.
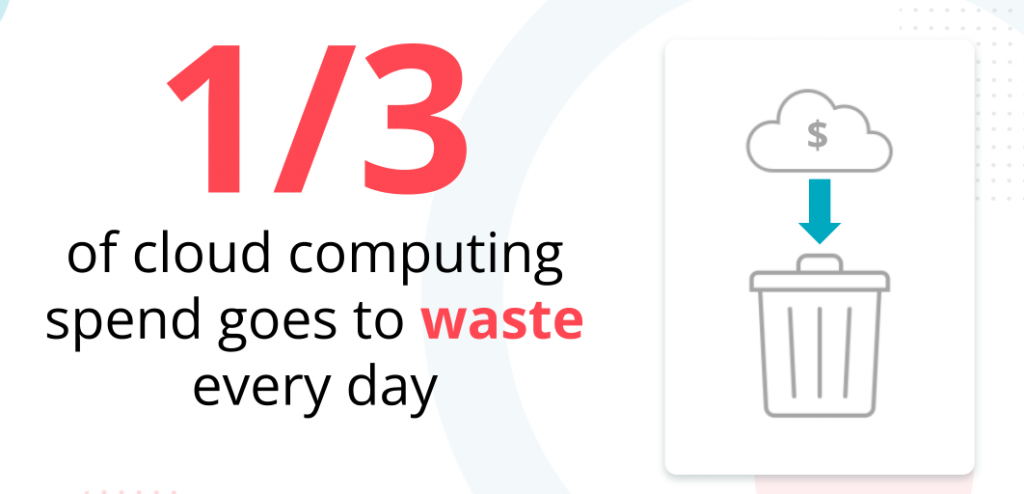
The FinOps Foundation recently reported that reducing waste has become a top priority among cloud practitioners, while the Flexera State of the Cloud 2023 report found that cloud spend overran budget by an average of 18 percent in their surveyed enterprises, resulting in nearly a third of cloud spend going to waste every day.
That’s a lot of waste!
Statistic taken from Flexera 2023 State of the Cloud Report
Waste Due to Peak Provisioning
Your developers allocate the memory and CPU they think their applications will need at peak, even if that peak time only represents a tiny fraction of the whole time the application is running. The reality is that during the application runtime, memory and CPU usage aren’t static; they go up and down. When the application is not running at peak, which might be as much as 80 or 90 percent of the time, that’s waste that you’re paying for.
The difference between the developer allocation and the actual usage is waste, which translates into unnecessary cost.
But Doesn’t Manual Tuning Fix This?
It’s a common thought that manual tuning can somehow fix this inherent overprovisioning. But allocating memory and CPU is not a “one and done” operation. The work profile or data set might change at any time, requiring allocations to be adjusted accordingly. Running your applications then becomes a neverending whack-a-mole story of constantly tuning and re-tuning to get close to actual usage.
And keeping up with the scale of a typical enterprise environment running around the clock managing sometimes hundreds of applications within a cluster is practically impossible.
Even beyond the difficulty of scale and complexity, humans are at a disadvantage tuning an environment since automated systems are already in place. For example, the automated system scheduler manages resource allocation. Your developers have requested a certain level of resources, and the scheduler gives them what they asked for, distributing resources based on allocation levels rather than actual usage.
The scheduler doesn’t know the allocated resources are not being used. As far as the scheduler is concerned, you asked for this level of resources, so you must be using that level.
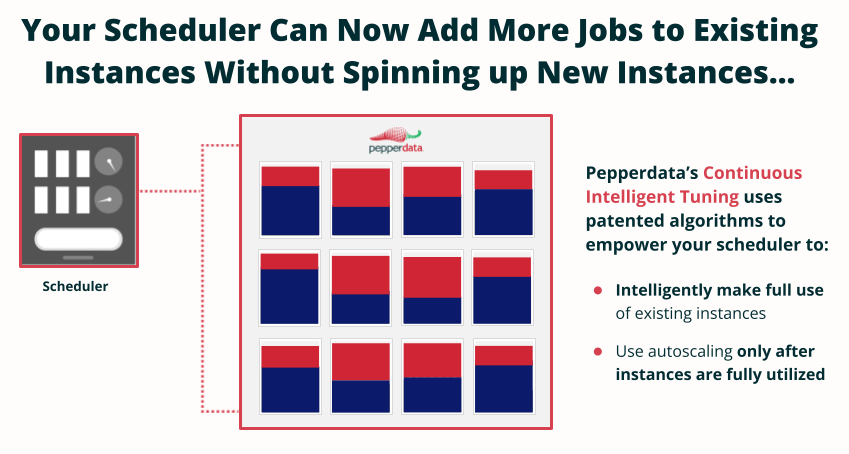
As a result, the system looks fully saturated and unable to take any more workload. The scheduler is not aware that applications may very well not be using all those requested resources at all times.
So when the system looks fully saturated and more applications come along, the scheduler has only two options:
- The scheduler can put the new workloads or applications into a queue or pending state until resources free up.
- The scheduler can direct the autoscaler to spin up new instances at additional cost, even though your existing resources are not fully utilized. You end up paying for resources you don’t need, or decreasing your job throughput unnecessarily.
Pepperdata solves this problem by changing the equation.
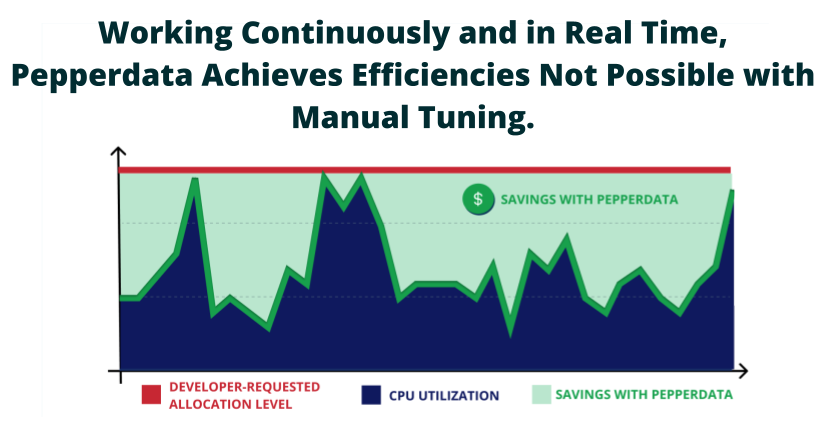
Through the power of real-time optimization at the application/platform level, Pepperdata can reduce cloud costs by an average of 30 to 47 percent, even in the most highly tuned clusters—and especially the ones where optimizations had already been implemented at the infrastructure level. It’s something that manual tuning just can’t achieve, no matter how many developers are assigned to the problem.
Using patented algorithms and Continuous Intelligent Tuning, Pepperdata provides the scheduler with real-time visibility into what’s actually available in your cluster, second by second, node by node, instance by instance. Pepperdata removes the blinders from the scheduler and provides it with a real working picture of what’s going on, intelligently informing the scheduler which instances can take more workload, dynamically and in real time. It’s real-time, Augmented FinOps.
If there’s a terabyte of waste in the cluster, for example, Pepperdata will scale the size of the cluster up in real time by a terabyte in response to this waste, knowing that more resources are available. As a result, your cluster is no longer bound by allocations.
Savings Power at Your Fingertips
And all of this is configurable. If your goal is 85 percent maximum utilization, (assuming the workload is there to achieve that utilization rate, you can choose your level of optimization so that Pepperdata will automatically and continuously work with the scheduler to always hit 85 percent utilization on a node by node basis. Pepperdata also has the intelligence to back off as the utilization gets close to the target you set.
There Is a Solution for Your Application Waste
By working autonomously and continuously at the application/platform layer, Pepperdata immediately reduces the overprovisioning that leads to structural, built-in application waste. Pepperdata real-time cost optimization reduces instance hours and cost, while also delivering higher utilization, improved parallelism, and greater throughput in your clusters.
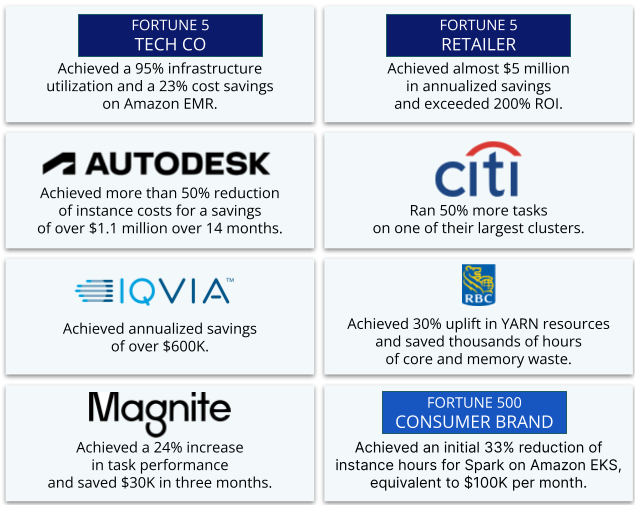
This ability to halve cloud costs at top enterprises may seem radical and new, but it’s absolutely not. Pepperdata has been hardened and battle tested since 2012. Pepperdata is currently deployed on about 100,000 instances and nodes across some of the largest and most complex cloud deployments in the world, including at security-conscious banks and members of the Fortune 5, saving our customers over $200M. Our customers on average are enjoying 30 percent on average and up to 47 percent savings for Spark workloads on Amazon EMR and Amazon EKS automatically.
It’s Easy to Get Started
You don’t need an engineering sprint or a quarter to plan for Pepperdata. It’s super simple to try out. In a 60-minute call, we’ll create a Pepperdata dashboard account with you. Pepperdata is installed via a simple bootstrap script into your Amazon EMR environment and via Helm chart into Amazon EKS.
You don’t need to touch or change your applications. Pepperdata deploys onto your cluster, and all the savings are automatic and immediate, with an average savings of thirty percent. It’s totally free to test in your environment.
An easy way to get started with Pepperdata is through a FREE Cost Optimization Proof of Value (POV). Pepperdata’s free POV provides results in just 5 days after Pepperdata installation and includes a detailed report about your current waste and estimated savings from Pepperdata Capacity Optimizer and review with a Pepperdata Architect.
You can even run the POV for up to 15 days for additional insights. Contact us at sales@pepperdata.com to get started.

