Extract the most from your cloud investment
Pepperdata enhances capacity optimization in your clusters in real time to save you 30–47% on average.
-

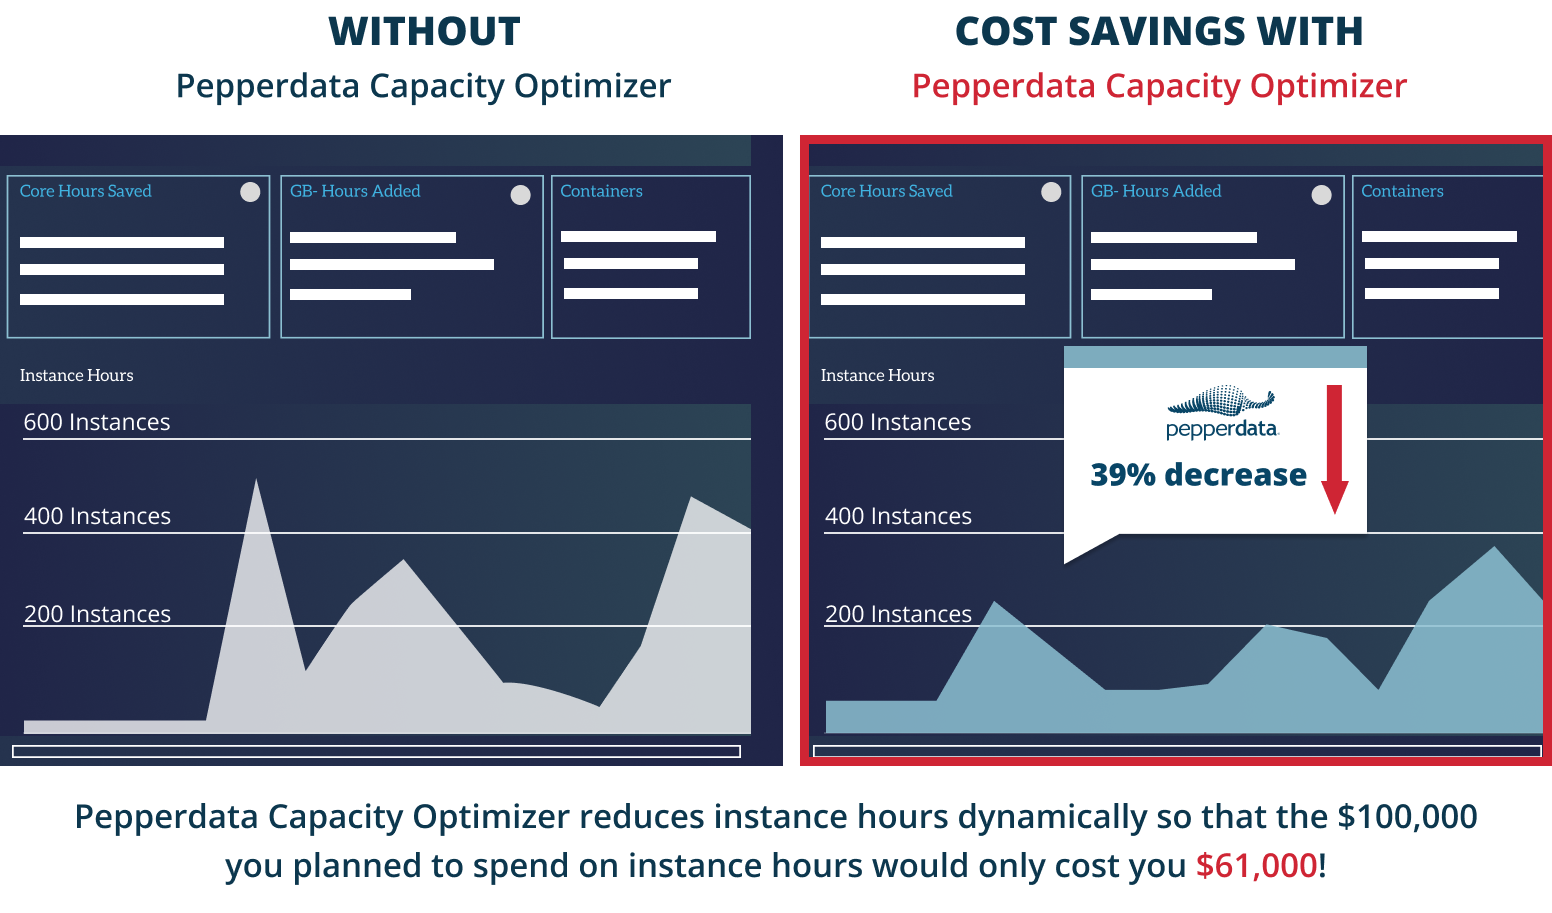
Reduce Instance Hours immediately
Decrease instance hour consumption by eliminating waste for reduced costs.
-
Optimize Spark clusters for peak efficiency
Optimize resource utilization and run more applications without changing your applications.
-
Tune resources automatically in real time
Free developers from manual resource optimization with automatic waste elimination.

Capacity optimization with Continuous Intelligent Tuning
Using Machine Learning (ML) and patented algorithms, Capacity Optimizer’s Continuous Intelligent Tuning:
- Rapidly identifies where more resource optimization can be done in real time
- Adds tasks to nodes with available resources
- Keeps your clusters running at the sweet spot of peak utilization
The result:
CPU and memory are automatically optimized
More applications can be launched
at equal costs
Developers are free to focus on innovation versus fine tuning apps
CPU and memory are automatically optimized
More applications can be launched
at equal costs
Developers are free to focus on innovation versus fine tuning apps

Autodesk Reduces Amazon EMR Costs by 50% and Boosts Capacity Optimization with Pepperdata
Pepperdata helped Autodesk successfully reduce Amazon EC2 costs by over 50 percent with real-time capacity optimization for its workloads and continuously optimized resource utilization.
BENCHMARKS
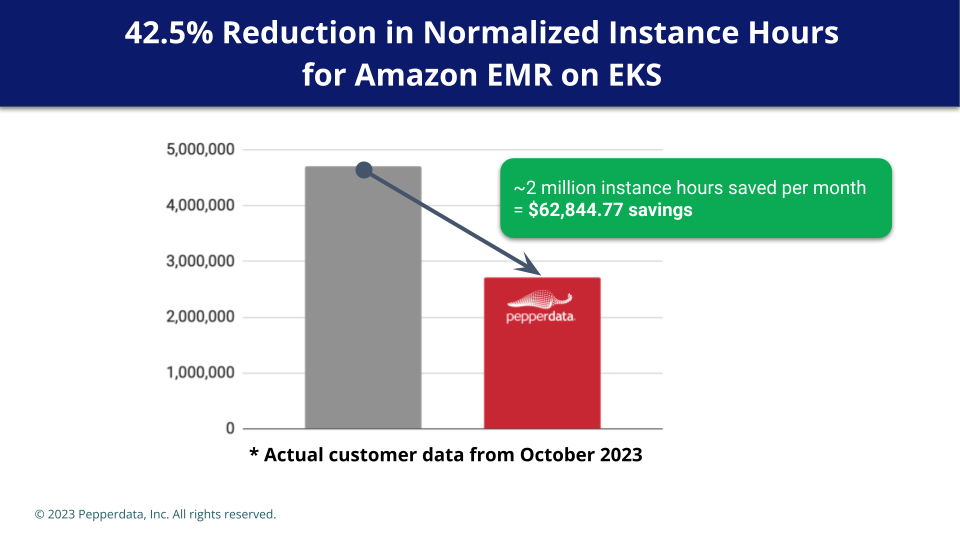
Capacity Optimizer for Spark workloads on Amazon EKS and Amazon EMR
Reduced the total instance hours and related costs by 41.8 percent and enabled the entire workload to run 45.5 percent faster
Enabled a production Amazon EMR workload running on Amazon EKS to run more efficiently and at 42.5 percent reduced cost
Optimized resource utilization with a 157 percent increase in CPU utilization and a 38 percent increase in memory utilization