Reduce Workload Costs with Autonomous, Real-Time Optimization
Reduce Workload Costs with Autonomous, Real-Time Optimization
- Eliminate the need for manual tuning or applying recommendations
- Increase the virtual capacity of every node to help run more jobs without increased spend
- Reduce the cost of running your clusters immediately
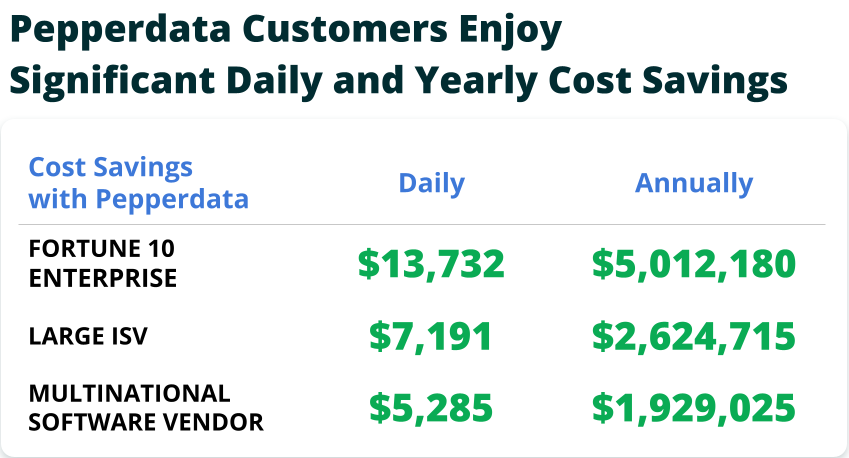
Savings at Scale Through Continuous Intelligent Tuning
Savings at Scale Through Continuous Intelligent Tuning
Savings at Scale Through Continuous Intelligent Tuning
Minimize the cost and waste of your clusters in real time without any need to apply application changes, recommendations, or manual tuning.
Minimize the cost and waste of your clusters in real time without any need to apply application changes, recommendations, or manual tuning.
Minimize the cost and waste of your clusters in real time without any need to apply application changes, recommendations, or manual tuning.
-

Decreased Instance Hour Consumption
Decreased Instance Hour Consumption
Decreased Instance Hour Consumption
Reduce hardware usage by up to 47 percent by only launching new instances once existing instances are fully utilized.
Reduce hardware usage by up to 47 percent by only launching new instances once existing instances are fully utilized.
Reduce hardware usage by up to 47 percent by only launching new instances once existing instances are fully utilized.
-
No Manual Tuning, No Recommendations,
and No Application ChangesNo Manual Tuning, No Recommendations, and No Application Changes
No Manual Tuning, No Recommendations, and No Application Changes
Keep costs and resources continuously optimized by automatically increasing the virtual capacity of every node in real time.
Keep costs and resources continuously optimized by automatically increasing the virtual capacity of every node in real time.
Keep costs and resources continuously optimized by automatically increasing the virtual capacity of every node in real time.


Learn how much Pepperdata Capacity Optimizer can save you today.
Learn How Extole Saved 30% on Amazon EC2 on EMR

Learn How Extole Saved 30% on Amazon EC2 on EMR
Ben Smith, VP of Technical Operations for Extole, discusses how his company met its savings goals with Pepperdata through:
- Running 27 percent more jobs without increased cloud costs
- Lowering Amazon EC2 costs by 30 percent within five days
- Freeing his engineering team from manual application tuning and tweaking